
Randi Weingarten, president of the 1.8-million-member American Federation of Teachers (AFT), was celebrating Democratic electoral victories. Her social media post praised political organizing and the role of labor unions in getting candidates elected.
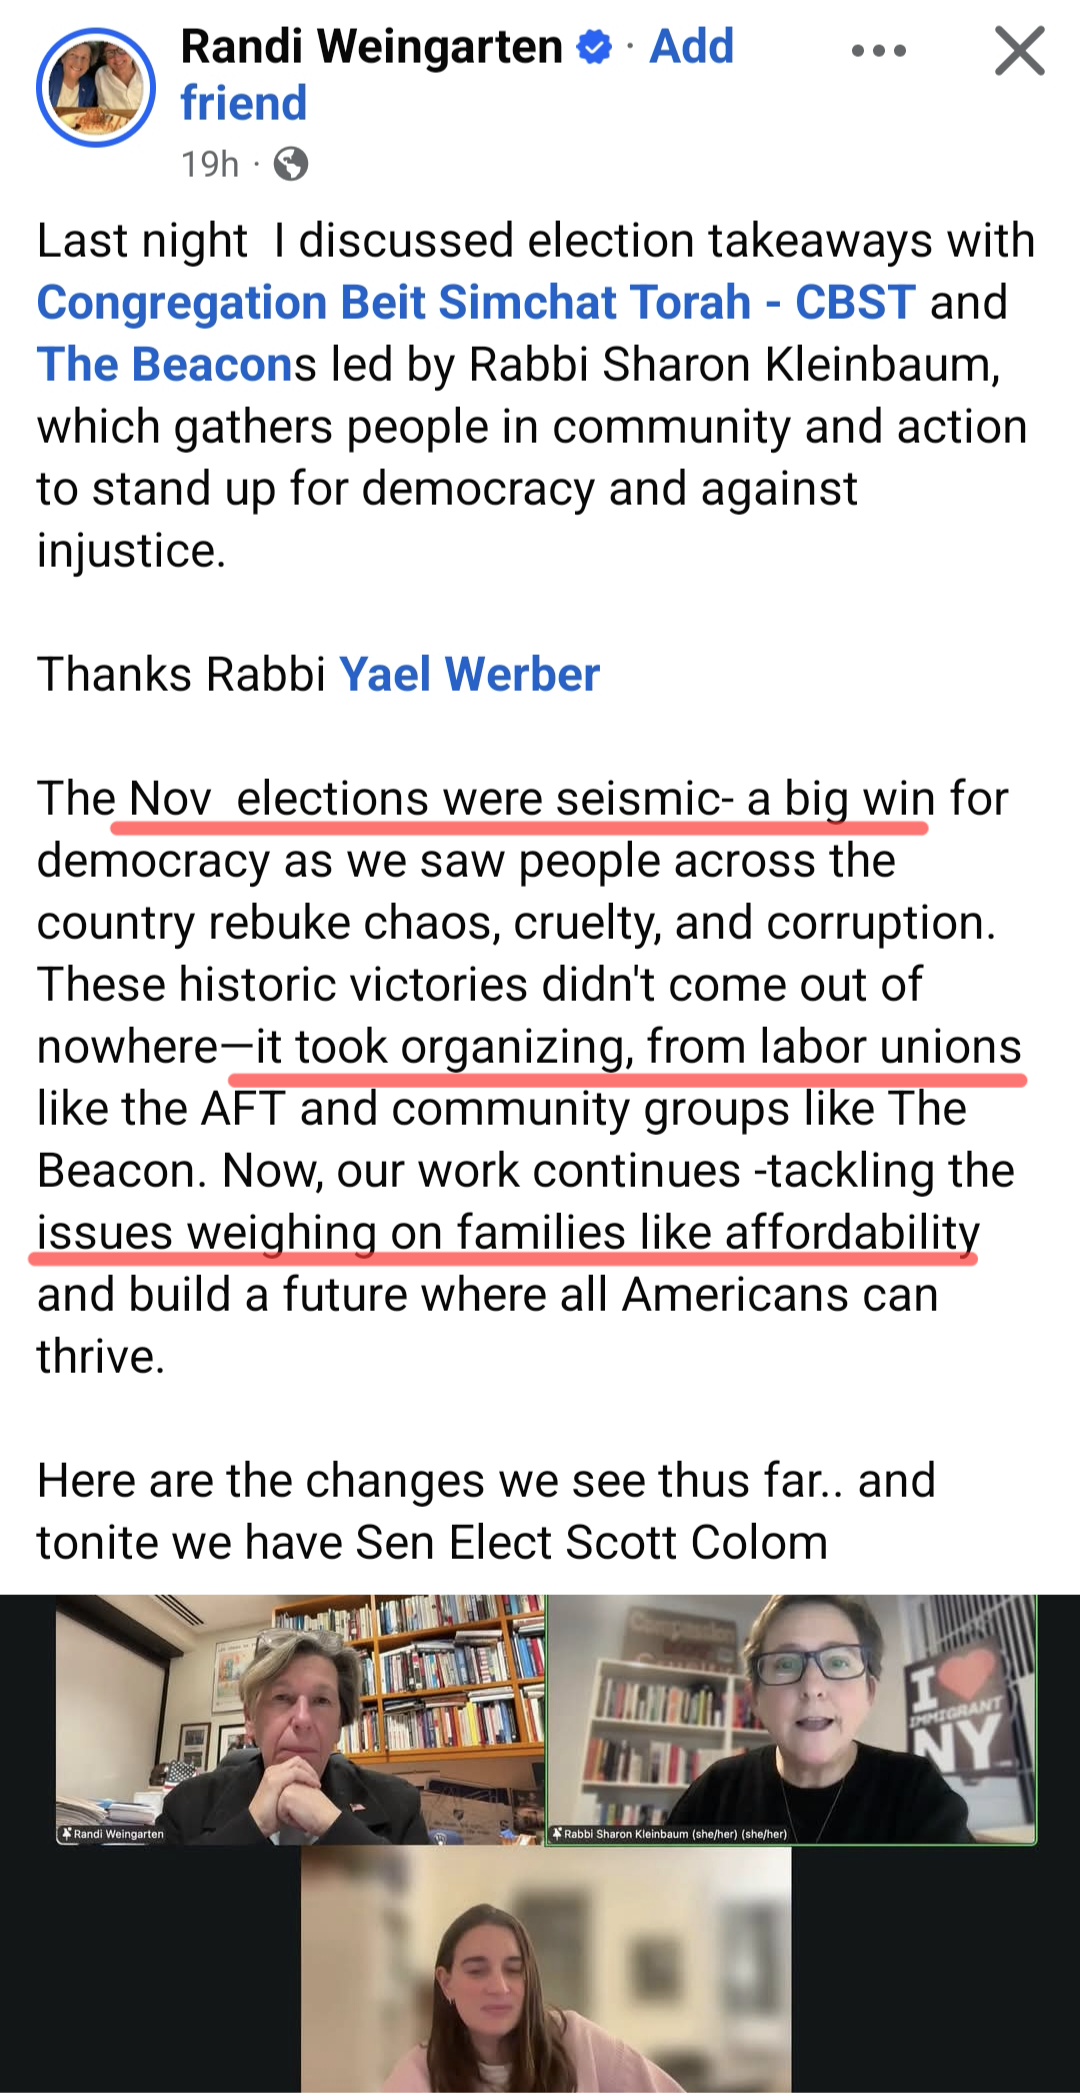
There was no mention of students, reading, mathematics or educational achievement.
Weingarten’s enthusiasm makes sense. Teachers’ unions collect dues, organize voters, support political candidates and lobby elected officials. Those officials influence school budgets, employment contracts, staffing rules and teacher accountability.
The unions help elect politicians who subsequently make decisions affecting the unions’ members.
Consider four states: Connecticut, New Jersey, New York and Florida.
| CT | NJ | NY | FL | |
|---|---|---|---|---|
| Governor’s party | D | D | D | R |
| Teachers in unions | 97.7% | 97.0% | 96.6% | 58.1% |
The three northeast Democratic-governed states have nearly universal teachers’ union membership. Republican-governed Florida has substantially less.
What do those unions secure for their members?
Higher Pay and More Teachers
| CT | NJ | NY | FL | |
|---|---|---|---|---|
| Average teacher salary | $89,593 | $84,974 | $98,655 | $56,663 |
| Students per teacher | 11.9 | 11.8 | 11.6 | 18.4 |
New York teachers earn approximately 74% more than Florida teachers. New York also employs approximately 59% more teachers relative to its student population.
Some of the salary difference reflects the higher cost of living in the Northeast. But the staffing difference is substantial. New York maintains roughly 86 teachers for every 1,000 students, compared with 54 in Florida. Higher salaries and more teachers per student are attractive benefits for educators.
What Happens When the Students Leave?
Public-school enrollment has declined across much of the Northeast. New York alone lost more than 165,000 students between 2019 and 2024.
One might expect the teaching workforce to decline alongside enrollment.
| Five-year change | CT | NJ | NY | FL |
|---|---|---|---|---|
| Student enrollment | −2.9% | −1.2% | −6.1% | ~0% |
| Teacher staffing | +1.5% | +0.7% | +0.5% | −6.1% |
New York lost 165,000 students and ADDED teachers.
Connecticut and New Jersey also increased teaching staff despite declining enrollment. Florida maintained approximately the same student enrollment while reducing teacher staffing by 6.1%.
Teachers’ unions have an obvious interest in preserving teaching positions. For taxpayers, maintaining staffing while enrollment falls can mean paying more per remaining student.
And New York taxpayers are paying considerably more.
Follow the Money
| Annual spending | CT | NJ | NY | FL |
|---|---|---|---|---|
| Per student | $26,316 | $27,234 | $31,918 | $12,693 |
New York spends $19,225 more per student every year than Florida, approximately 151% more, due to many more teachers per student and much higher salaries for teachers.
These figures include salaries, benefits, administration, transportation and other operating expenses. They exclude major capital construction and are not adjusted for regional living costs.
One might wonder whether New York is educating a much more challenging student population.
Are the Students Different?
Poverty and English-language proficiency affect educational outcomes. Schools serving disadvantaged students frequently require additional resources.
| Student demographics | CT | NJ | NY | FL |
|---|---|---|---|---|
| English-language learners | 9.4% | 8.2% | 9.7% | 9.5% |
| Low-income students* | 41.9% | 36.1% | 57.1% | ~54% |
New York and Florida have similar reported percentages of English-language learners and economically disadvantaged students. Meanwhile, New Jersey has lower percentages of both, which may help explain some of its stronger academic performance.
The student populations are hardly identical, but the demographic figures offer little obvious explanation for New York spending two and a half times as much as Florida.
What Do Students Get for the Money?
The National Assessment of Educational Progress (NAEP) provides standardized mathematics and reading examinations across states, allowing direct comparisons of academic performance.
Here are the 2024 results.
| NAEP average score | CT | NJ | NY | FL |
|---|---|---|---|---|
| 4th-grade math | 239 | 240 | 234 | 243 |
| 4th-grade reading | 219 | 222 | 215 | 218 |
| 8th-grade math | 277 | 282 | 271 | 267 |
| 8th-grade reading | 263 | 266 | 257 | 253 |
Florida outperforms New York in both fourth-grade subjects, despite spending less than half as much per student. By eighth grade, New York pulls ahead, but only by four points in mathematics and four points in reading. New Jersey leads three of the four categories while spending approximately 15% less per student than New York.
New York spends two and a half times as much as Florida, yet its students score worse in fourth grade and only modestly better in eighth.
The Political Machine Keeps Humming
Teachers’ unions secure higher salaries, more teachers per student and job protections. They help elect politicians who approve the budgets and laws sustaining those benefits.
In New York, students leave, teachers stay, and taxpayers continue funding one of the nation’s most expensive public-school systems, with little corresponding academic advantage.
Weingarten concluded her post by promising to tackle the issues weighing on families, including “affordability.”
Perhaps she should start with the teachers’ unions. Their demands contribute to the school spending and property-tax burdens making life less affordable for the very families she claims to champion.
Sources and data notes: Teacher union membership is from the 2020–21 federal teacher survey, as reported by the Thomas B. Fordham Institute. Per-pupil spending is from the U.S. Census Bureau, FY2024. Teacher salaries are from the National Education Association, 2024–25. Enrollment and teacher staffing changes are from federal education data for fall 2019–2024. NAEP scores are from the 2024 National Assessment of Educational Progress. English-language learner percentages are from NCES. Student-teacher ratios refer to full-time-equivalent teachers, not classroom size.
Low-income figures use school-meal eligibility as a proxy and are drawn from different reporting periods. Florida’s approximate figure and full cross-state comparability remain to be verified before publication.


